Exporting Plots in MATLAB: A Guide for the Perfectionist
There's no denying that the easiest way to export a figure in MATLAB is through the toolbar on the figure panel. You can select the output folder and name the export, choosing a file type. Generally, this is fine. But for exporting lots of plots for perhaps an animation, the export process should be automated. Here I present a couple options, as well as my preferred method.

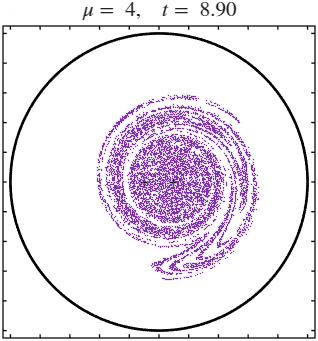
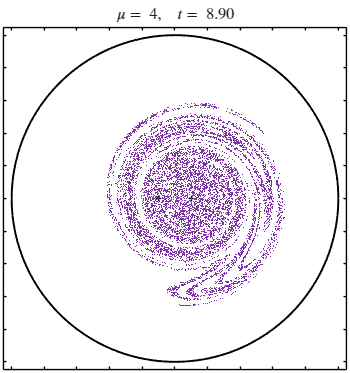
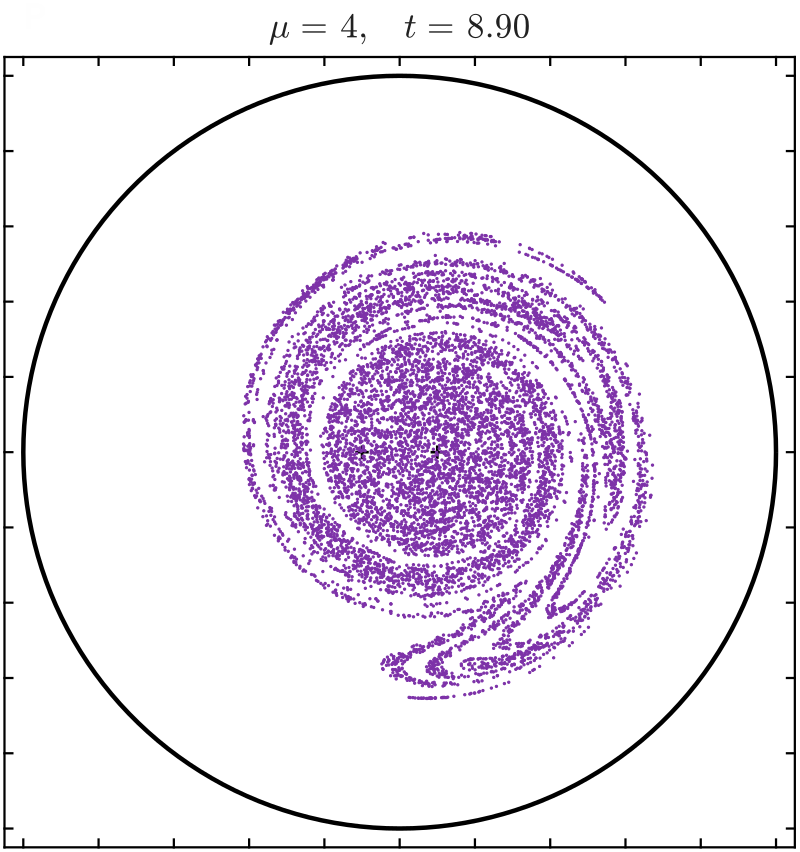
For this example, I’ll use a figure with lots of particles (dots) in a circular boundary, with a title placed above the axes. It’s important to keep in mind that in MATLAB’s figures, the size of elements like ‘LineWidth’, the ‘FontSize’ of titles/subtitles, or legends, are sized relative to the screen size of the figure. That is to say, if I increase the figure size, the relative size of those elements will decrease. This is fine in and of itself, but something that always needs to be kept in mind. For instance, what if I manually size the figure so that the ratio of the size elements and axes are as desired, but I want to export the figure to a larger or smaller pixel size than what is displayed? Controlling both of these variables—figure size and resolution—are of principal importance when exporting a sustainable number of figures. If I’m combining the images into a video, it will likely find itself on a google slides presentation or this website, both of which are going to place restrictions on storage size of the video. Alternatively, if storage size is not an issue, I want the images or videos to look as nice as possible, which necessitates finely controlling the relative size of the figure’s elements, and the resolution. With these objectives considered, here are a few ways to automate the export process of figures in MATLAB.
Method #1: ‘exportgraphics()’ with ‘Resolution’
This method is the simplest, and the most backwards compatible (until 2020a). I’ll call a function to create the plot, and export using ‘exportgraphics()’ with the name-value argument ‘Resolution’. This will set the DPI (dot-per-inch) of the image file, which is mainly for printing purposes, but will also impact the image size. The default resolution can be found using get(groot,"ScreenPixelsPerInch"). This ‘sppi’ times the figure size in inches will give a near estimate for the pixel size of the limiting dimension of the figure (the dimension without the extra whitespace). I use some multiplier of the ‘sppi’ value, rounded, to get a larger sized image. The exact size of the output image can be at best estimated.
The function advectionFigure() is a custom function to automate the figure creation. It is basically a slightly modified version of this function. An important note is that between the “Large Figure” and “Smaller Figure” the specified line widths and font sizes are the same, but they will appear thicker/thinner depending on specified ‘figureSize’, which modifies the ‘width’ and ‘height’ of the ‘Position’ name-value argument of the figure. This is what I mean by the size of those elements being relative.


Method #2: ‘exportgraphic()’ with ‘Width’ or ‘Height’
This will require MATLAB 2025a or newer. Here you can directly specify the exact pixel dimension you would like to export with, and the figure’s elements will be scaled up or down as required. Specifying only ‘Width’ or only ‘Height’ will preserve the aspect ratio, while specifying both will stretch the export irrespective of the original aspect ratio.


Method #3: ‘exportgraphic()’ as .svg, convert to image with CLI tools
This is my preferred method, but be aware it does require MATLAB 2025a or newer. Here I export as an SVG (Scalable Vector Graphics), and then convert to an image (.jpg or .png) with a given width or height, and preserve aspect ratio. Plots created this way are crisper than those in the other two methods. The particles in the figures from the first two are almost square looking, but clearly appear as circles in this last method (this is most visible on the “Smaller Figure, Large Width/Export Size” images). This almost certainly has to do with how MATLAB handles the rasterization process, and the effects will be more noticeable on smaller elements like markers, complex curves or shapes, or text.
The function svgToImgs() is a custom function that can be found here. It calls the command-line tools "rsvg-convert", "magick" (ImageMagick) to do the conversions. The function is written for Windows machines and the command-line programs will need to be properly added to your PATH for the function to operate.


Caveat for Method #3
One major benefit of this method is it will fix an issue that often arises for me: figure images resizing slightly based on the text in the title. When exporting figures, MATLAB will automatically cut unused whitespace, (unless you change the name-value argument Padding to “figure”). If using the latex Interpreter, the amount of vertical whitespace decreases slightly (by a pixel) if the tallest character is a ‘5’. This can often arise when creating animations with the time in the title. Using frames of different sizes will either cause the videomaking process to fail, or the small frames will be stretched/padded to the larger size, causing the contents of the video to change position slightly every few frames, as can be seen below. However, this method can induce a different problem: a black bar on the right side of the exported figure, also shown below. This is not guaranteed to happen, but is a common occurrence for figures of certain sizes. But it is consistent, meaning if one frame has it, all frames will have it. This is an easier problem to deal with than the ‘5’ resize issue. Personally, I find this an easier problem to deal with. I remedy it with a MATLAB function that loads the images, checks for the presence of the bar, and adds a rectangle 'X' pixels wide and as tall as the figure height to images with a system call to an FFMPEG command.


A final tip: If creating a large amount of figures to save for an animation, I strongly recommend turning ‘Visible’ ‘off’. I have found it has better performance and additionally, if left ‘on’, some figures do not get properly closed.